
Canada Housing Market Report 2023
Last Updated: August 30, 2023
Highlights (updated August 2023)
- National home sales experienced a 0.7% decrease month-over-month in July
- The actual (not seasonally adjusted) national average sale price was $668,754 in July, an increase of 6.3% year-over-year in July.
- The MLS® Home Price Index (HPI) climbed 1.1% month-over-month and was down 1.5% year-over-year.
Summary (updated July 2023)
This national and provincial housing market report is here to help you understand what’s going on in the real estate market in Canada.Monthly National Statistics for Canada
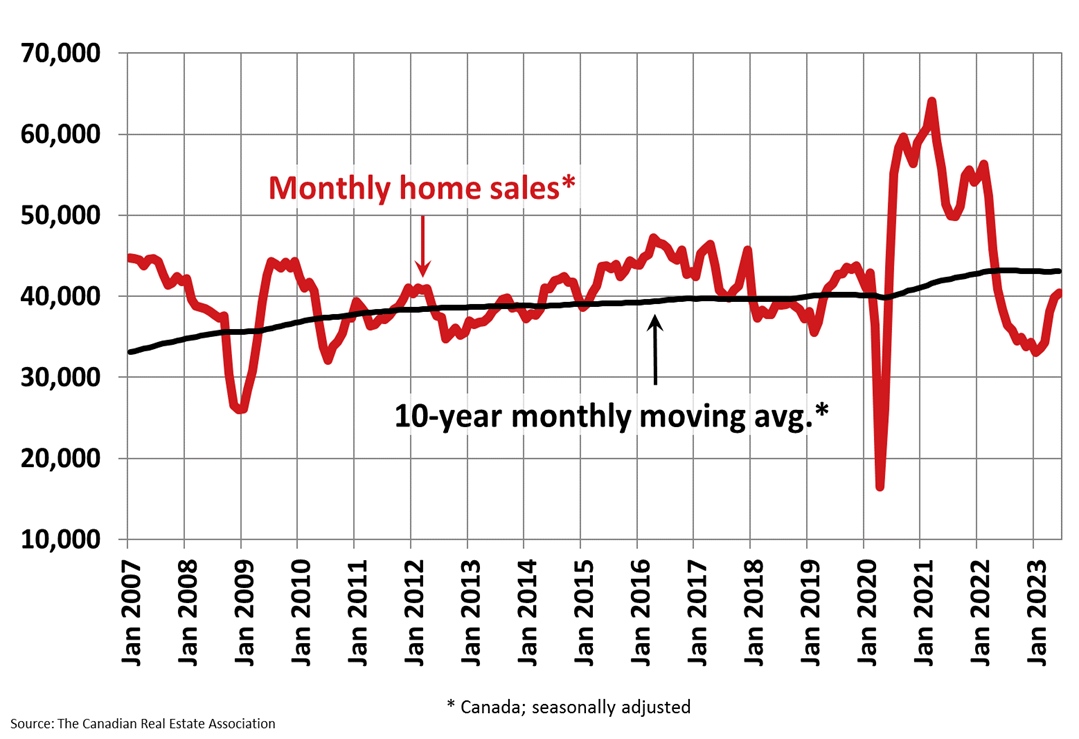
(Source: CREA)
Between June and July 2023, home sales in Canada experienced a 0.7% decrease, with activity showing signs of stabilizing since May. Sales were up in July in more than half of all local markets. Sales were down in Fraser Valley and the GTA, which offset gains in Montreal, Edmonton and Calgary.
The number of transactions (not seasonally adjusted) in July came in 8.7% above compared to July 2022. This is the largest year-over-year sales growth in over two years. Market trends have started to stabilize, with sales leveling off and more normal levels of new listings, which has slowed down the pace of price growth and given buyers more options.
Larry Cerqua, The chair of CREA and Shaun Cathcart, CREA’s Senior Economist have noted that this trend continued in July and has led to a more balanced market. The Bank of Canada’s rate hike in July and discussions about inflation staying above target have influenced a slowdown in sales and price growth. This could result in buyers backing off until there is more certainty about future rates.
The number of newly listed homes increased by 5.6% on a month-over-month basis in July compared to June, continuing a trend of growth that was seen earlier in the year (2.8% in April, 7.9% in May 2023 and 5.9% in June 2023). After hitting a 20 year low in March, this brought new listings closer to the average levels.
New listings in July exceeded sales, which resulted in a decrease in the sales-to-new listings ratio from 63% in June to 59.2% in July. The national inventory at the end of July was 3.2 months, exceeding the 3.1 months in May and June. This was the first month-over-month increase since January but is still approximately 2 months below the long term average for this measure (five months).
The Aggregate Composite MLS® Home Price Index (HPI) climbed 1.1% in July compared to June. It was only half the size of the gains seen in April, May and June, which aligns with sales stabilizing as new listings recover.
A trend that has been persisting since April is local market price increases. Although there was a modest national gain, local market prices still increased between June and July. The HPI is now just 1.5% lower compared to levels last year, making this the smallest decline since October 2022. Year-over-year comparisons are expected to turn positive in the coming months because prices continued to decline through the second half of 2022. The actual (not seasonally adjusted) national average home price was $668,754 in July 2023, up 6.3% from July 2022.
(Source: CREA)
Average home prices by province
| Province | Average Home Price (July 2023) | July 2022 | Y/Y % Change |
|---|---|---|---|
| British Columbia | $966,181 | $916,534 | 5.4% |
| Ontario | $856,269 | $829,809 | 3.2% |
| Quebec | $492,190 | $479,806 | 2.6% |
| Alberta | $452,387 | $434,689 | 4.1% |
| Nova Scotia* | $401,000 | $384,600 | 4.3% |
| Prince Edward Island* | $360,700 | $370,200 | -2.6% |
| Manitoba | $352,352 | $353,309 | -0.3% |
| Saskatchewan* | $333,100 | $333,200 | 0.0% |
| New Brunswick* | $292,300 | $296,200 | -1.3% |
| Newfoundland and Labrador* | $289,800 | $285,600 | 1.5% |
*Areas displaying MLS HPI benchmark prices, other areas display average prices.
(Source: CREA)
Toronto housing market report
Year-over-year summary
| 2023 | 2022 | % change | |
|---|---|---|---|
| Sales | 5,250 | 4,870 | 7.8% |
| New listings | 13,712 | 12,294 | 11.5% |
| Active listings | 15,371 | 15,329 | 0.3% |
| Average price | $1,118,374 | $1,073,213 | 4.2% |
| Avg. LDOM (listing days on market) | 17 | 19 | -10.5% |
| Avg. PDOM (property days on market) | 24 | 29 | -17.2% |
(Source: TRREB)
In July 2023, home sales and average selling prices in the Greater Toronto Area (GTA) remained high, compared to last year’s levels. Seasonally adjusted sales were more balanced in July compared to June, as sales trended lower while new listings went up.
There were 5,250 sales in July which is a 7.8% increase compared to July 2022. The number of new listings were up by a greater annual rate of 11.5%. The MLS® HPI Composite benchmark was up by 1.3% on a year-over-year basis. The average selling price was up 4.2% to $1,118,374 over the same period. The number of sales trended lower for the second straight month on a seasonally adjusted monthly basis, while new listings trended up. The seasonally adjusted average selling price trended lower while the MLS® HPI Composite benchmark trended higher.
TRREB’s Chief Market Analyst, Jason Mercer, highlighted the uncertainty surrounding borrowing costs, employment, and the economy has influenced recent home sales trends. Despite strong long-term demand due to record population growth, current homebuyers are hesitant due to unclear monetary policy and economic conditions. Additionally, TRREB’s CEO, John DiMichele, TRREB’s CEO, emphasized the disconnect between high immigration targets and insufficient housing development, urging coordinated efforts from all levels of government to address this issue.
Detached homes
- Sales of detached homes in July 2023 reached 2,378, a 9.1% increase compared to July 2022.
- The benchmark price for a detached home was $1,427,257, a 4.8% increase from July 2022.
Semi-detached
- Sales of semi-detached homes in July 2023 reached 445 a 4.9% decrease compared to July 2022.
- The benchmark price for a detached home was $1,101,876, a 2.8% increase from July 2022.
Condo apartments
- Sales of apartment homes reached 1,505 in July 2023, a 11.1% increase compared to July 2022.
- The benchmark price of a condo apartment was $735,171, a 2.1% decrease from July 2022.
Townhouse
- Townhouse sales totaled 875 in June 2023, a 7.5% increase compared to July 2022.
- The benchmark price of an attached home was $940,113, a 5.8% increase from July 2022.
Historical annual statistics
| Year | Sales | Average price |
|---|---|---|
| 2019 | 87,747 | $819,153 |
| 2020 | 95,066 | $929,636 |
| 2021 | 121,712 | $1,095,475 |
| 2022 | 75,054 | $1,189,747 |
| 2023 (year to date) | 43,908 | $1,118,374 |
(Source: CREA)
Vancouver housing market report
In July 2023, Metro Vancouver’s housing market continued to experience a rise in home prices as strong sales figures continued to push up against low levels of housing inventory in the region.
Residential home sales reached 2,455 a 28.9% increase compared to the 1,904 sales recorded in July 2022, 15.6% below the 10 year seasonal average. However, they are up 30% year-over-year. Last July was when the Bank of Canada announced their 1.00% increase, which chilled market activity at the time.
Newly listed properties in July 2023 totaled 4,649, a 17% increase compared to the 3,975 listed homes in July 2022. This was 5.2% below the 10-year seasonal average of 12,039.
The sales-to-active listings ratio for July 2023 was 24.9% for all property types. By property type, the ratio was 16.5% for detached homes, 32% for townhomes, and 30.6% for apartments.
The MLS® Home Price Index composite benchmark price for all residential properties in Metro Vancouver was $1,210,700 in July representing a 0.5% increase from July 2022 and a 0.6% increase compared to June 2023.
Detached homes
- Sales of detached homes in July 2023 reached 681, a 28.7% increase compared to July 2022.
- The benchmark price for a detached home was $2,012,900, a 0.6% decrease from July 2022. Average days on the market was 29 days.
Apartments
- Sales of apartment homes reached 1,281 in July 2023, an 20.7% increase compared to July 2022.
- The benchmark price of an apartment home was $771,600, a 2.6% increase from July 2022. Average days on market was 23 days
Attached homes
- Sales of attached home sales totaled 466 in June 2023, an 53.3% increase compared to July 2022.
- The benchmark price of an attached home was $1,104,600, a 1.2% increase from July 2022. Average days on the market was 18 days.
Fraser Valley housing market report
In July, the Fraser Valley Real Estate Board (FVREB) processed 1,368 on its Multiple Listing Service (MLS), showing a decrease of 29.3% compared to June 2023 but 37.8% above July 2022. The FVREB received 2,855 new listings in July, down by 16.6% compared to June but 19.7% higher than July 2022. The total active inventory at the end of July was 6,199, representing a 4.3% increase from June.
There was a slowdown in the real estate sector due to higher interest rates. Both buyers and sellers are being cautious, which led to reduced activity and fewer competitive bids.
Single Family Detached
- At $1,543,300 the Benchmark price for an FVREB single-family detached home increased 1.1% compared to June 2023 and decreased 3.1% compared to July 2022.
- Average days on market was 22 days
Townhomes
- At $850,300, the Benchmark price for an FVREB townhome increased 0.6% compared to June 2023 and decreased 2.7% compared to July 2022.
- Average days on market was 16 days
Apartments
- At $555,500, the Benchmark price for an FVREB apartment/condo increased 0.6% compared to July 2023 and increased 0.8% compared to July 2022.
- Average days on market was 18 days
(source: FVREB)
Calgary housing market report
In July, there were 2,647 sales which represents a year-over-year increase of 18%, the highest July levels ever recorded. This growth was driven by significant gains in the affordable apartment condominium sector. However, year to date sales still went down by 19% compared to last year. Inventory levels remained close to the record low set in July 2006. The market is in favour of sellers, with sales-to-new listings ratio being 82% and a 1.3% month supply of homes. Supply shortages in the resale, new home and rental markets are driving home prices higher. In July, the unadjusted total residential benchmark price reached $567,700 which makes this the seventh consecutive monthly gain.
Semi-Detached- There were 248 new listings and 211 sales
- Benchmark price reached $616,800 representing a 7% increase year-over year
- Average days on market was 20 days
- There were 488 new listings and 467 sales
- Sales to new listings ratio was 96%. This prevented additions to the inventory and left the months of supply below one more for the fourth consecutive month.
- Benchmark price reached $407,500, nearly 2% higher than the previous month and over 14% higher than the previous year
- Average days on market was 20 days
- Year-to-date sales increased by 16% compared to the previous year. The only property type experiencing a year-to-date increase in sales is attributed to recent growth in new listings.
- sales-new-listings ratio was 84% and a month’s supply of 1.4 months.
- Benchmark price reached $305,900, nearly 1% higher than the previous month and over 12% higher than the previous year
- Average days on market was 27 days
(Source: CREB)
Edmonton housing market report
In July 2023, residential unit sales reached 2,323 a 14.9% increase compared to July 2022 but a 10.4% decrease from June 2023. New residential listings declined by 7.7% year-over-year from July 2022 and 9.2% drop from June 2023. Overall inventory in the GEA decreased by 17.3% from July 2022 and down 2.4% from June 2023.
Detached unit sales for July were up 10.9% compared to July 2022 and decreased by 12.7% from June 2023, totaling 1,291 sales. Semi-detached unit sales declined by 11.2% month-over-month but increased by 11.2% July 2022. Row/townhouse unit sales were up 19.7% year-over-year and 5.4% down from June 2023. However, apartment condominium unit sales saw increases of 31.6% from July 2022 but decreased by 4.3% from the previous month.
The total residential average prices reached $409,986 showing a 2.0% decrease from July 2022 and a 2.3% drop from June 2023. Detached homes averaged $503,542 representing a 0.8% year-over-year drop and a 0.6% increase from June 2023. Semi-detached homes sold for an average of $378,902, indicating a small 2.7% increase year-over-year and a 1.0% decrease from the previous month. Row/townhouse prices increased by 3.8% from July 2022 and 2.6% month-over-month, averaging at $264,128. Apartment condominium average prices stood at $194,823 showing a 0.1% increase from last month and a 3.1% drop from July 2022.
The MLS® Home Price Index (HPI) composite benchmark price in the GEA was $381,800, reflecting a 0.5% decrease from June 2023 and a 6.2% decrease from July 2022.
Detached homes averaged 44 days (4 days more than in June), semi-detached homes averaged 35 days (1 day more), row/townhouses averaged 41 days (1 day more), and apartment condominiums averaged 58 days (3 days more). For all residential listings combined, the average time on the market was 45 days, marking a 7-day increase from the previous year and a 3-day increase from June 2023.
Detached homes- Unit sales were up 10.9% from July 2022 and decreased 12.7% from June 2023 at 1,391
- Prices averaged $503,542, noting a 0.8% year-over-year drop and a 0.6% increase from June 2023
- Average days on market was 44 days
- Unit sales were down 11.2% month-over-month but increased by 11.2% from this time last year
- Prices averaged $378,902, resulting in a 2.3% increase year-over-year, and a decrease of 1.0% from the previous month
- Average days on market was 35 days
- Unit sales were up 19.7% from July 2022, but dropped 5.4% from June 2023
- Prices were up both 3.8% from July 2022 and 2.6% month-over-month, selling at $264,128.
- Average days on market was 41 days
- Unit sales had an increase of 31.6% from July 2022, while noting a decrease of 4.3% from the previous month.
- Average prices hit $194,823 showing a small decrease of 0.1% from last month and a drop of 3.1% from July 2022
- Average days on market was 58 days
Montreal housing market report
In July, the average home sold price in Montreal reached $598,424 which was a 3.8% increase from July 2022. There were 3,098 transactions which was a 0.6% increase from July 2022 and a 14.6% decrease from the previous month.
At the end of June 2023, there were 14,820 active listings, indicating a significant increase of 20% compared to the same period last year. However, there were 4,354 new listings, which showed a decrease of 9% compared to the previous year. The sales-to-new listings ratio (SLNR) for the month stood at 71%. A SLNR of 40-60% represents a bal;anced market, while a SLNR above 60% will represent a market in favour of sellers.
Single-family detached
- Averaged $550,000 a 1% year-over-year increase
- There were 1,649 transactions which was a 3% increase from July 2022 but a 13% decrease from June 2023
- Average days on market was 46 days
Condo
- Averaged $395,000, a 0.90% year-over-year increase and a 1.3% increase from the previous month.
- There were 1,130 transactions which was a 4.5% decrease from July 2022 and a 19% decrease from the previous month
- Average days on market was 56 days
Plex
- Averaged $735,000, a 5.3% year-over-year decrease and a 1.2% increase from the previous month
- There were 317 transactions which was a 13% increase from July 2022 and a 6.2% decrease from the previous month
- Average days on market was 71 days
(Source: FMSI)
Canada housing market report FAQ
How do I interpret average days on market?
Days on market refers to the number of days a home has been on the market and is one of the best indicators of whether you’re in a buyer’s market or a seller’s market. When properties in an area are on the market for a short period of time, this means demand is high, inventory is low and buyers will move quickly in order to get the property they want. This ultimately means you are in a seller’s market, where there are more buyers looking for homes than there are homes available for sale. When the time on the market is longer, this means houses are taking longer to sell and can mean there is lower demand, indicating that you are in a buyer’s market where there are more homes for sale than there are buyers actively looking to buy. In this case, buyers might be pickier and sellers might need to be more accommodating in order to sell.
What does it mean if the number of listings is increasing?
When the number of listings is increasing, this means that there are more properties available on the market and are being listed for sale. When there are more listings on the market, it is in favour of buyers as they have more options to compare and choose from and prices are usually lower. Sellers will have to compete with each other in order to attract buyers.
What does it mean if the number of listings is decreasing?
When the number of listings is decreasing, this means that there are less properties available on the market and being listed for sale. When there are less listings on the market, demand exceeds supply resulting in many interested buyers, but the real estate inventory is low. Sellers are at an advantage since properties tend to sell faster, and buyers must compete with each other in order to score a property.
What does it mean if the average selling price is increasing? How does that impact me as a buyer or seller?
When average selling price is increasing, this means that prices at which houses are being sold on average, are rising over a specific period of time, usually yearly or monthly.
As a buyer, this can reduce affordability as increased home prices can make it more challenging to afford a home within your budget and can also limit your options. Rising prices can also lead to more competition between buyers as it creates a competitive market, resulting in bidding wars and difficulty securing a home within a reasonable price range. This can also mean that mortgage lenders will adjust their rates accordingly and can lead to higher monthly mortgage payments due to increased loan amounts or interest rates.
As a seller, rising selling prices can result in your property being assessed at a higher price by lenders. Which means that your property value might have appreciated and can lead to higher profits when you sell your home. The proceeds gained when selling your home can be invested into other properties or investments, and will also give you greater negotiating power as buyers might be more willing to meet your asking price and terms, especially when it’s a competitive market.
You can read more about the Canada interest rate forecast for 2023 here.
